How Tape Diagrams Help Students Make Sense of Math Word Problems
If you’ve ever watched your students read a math word problem, hunt for a “keyword,” and choose an operation that doesn’t actually match the situation, you’re not alone. Teaching students to understand what a word problem is really asking, not just which operation to use, can be challenging. That’s where tape diagrams come in.
These visual models help students see the relationship between quantities, organize the given information, and make sense of the problem. By representing the situation visually, students can determine which operation(s) reflect the situation and truly understand the math before they even start computing.
In this blog, you’ll learn what tape diagrams are, why they’re such an effective problem-solving tool, and practical ways to use them across all four operations and multiple grade levels.
What is a Tape Diagram?
You may have heard these models referred to as bar models or strip models, but they are more commonly known as tape diagrams. The name comes from the long rectangles used in the models, which can look like pieces of tape.
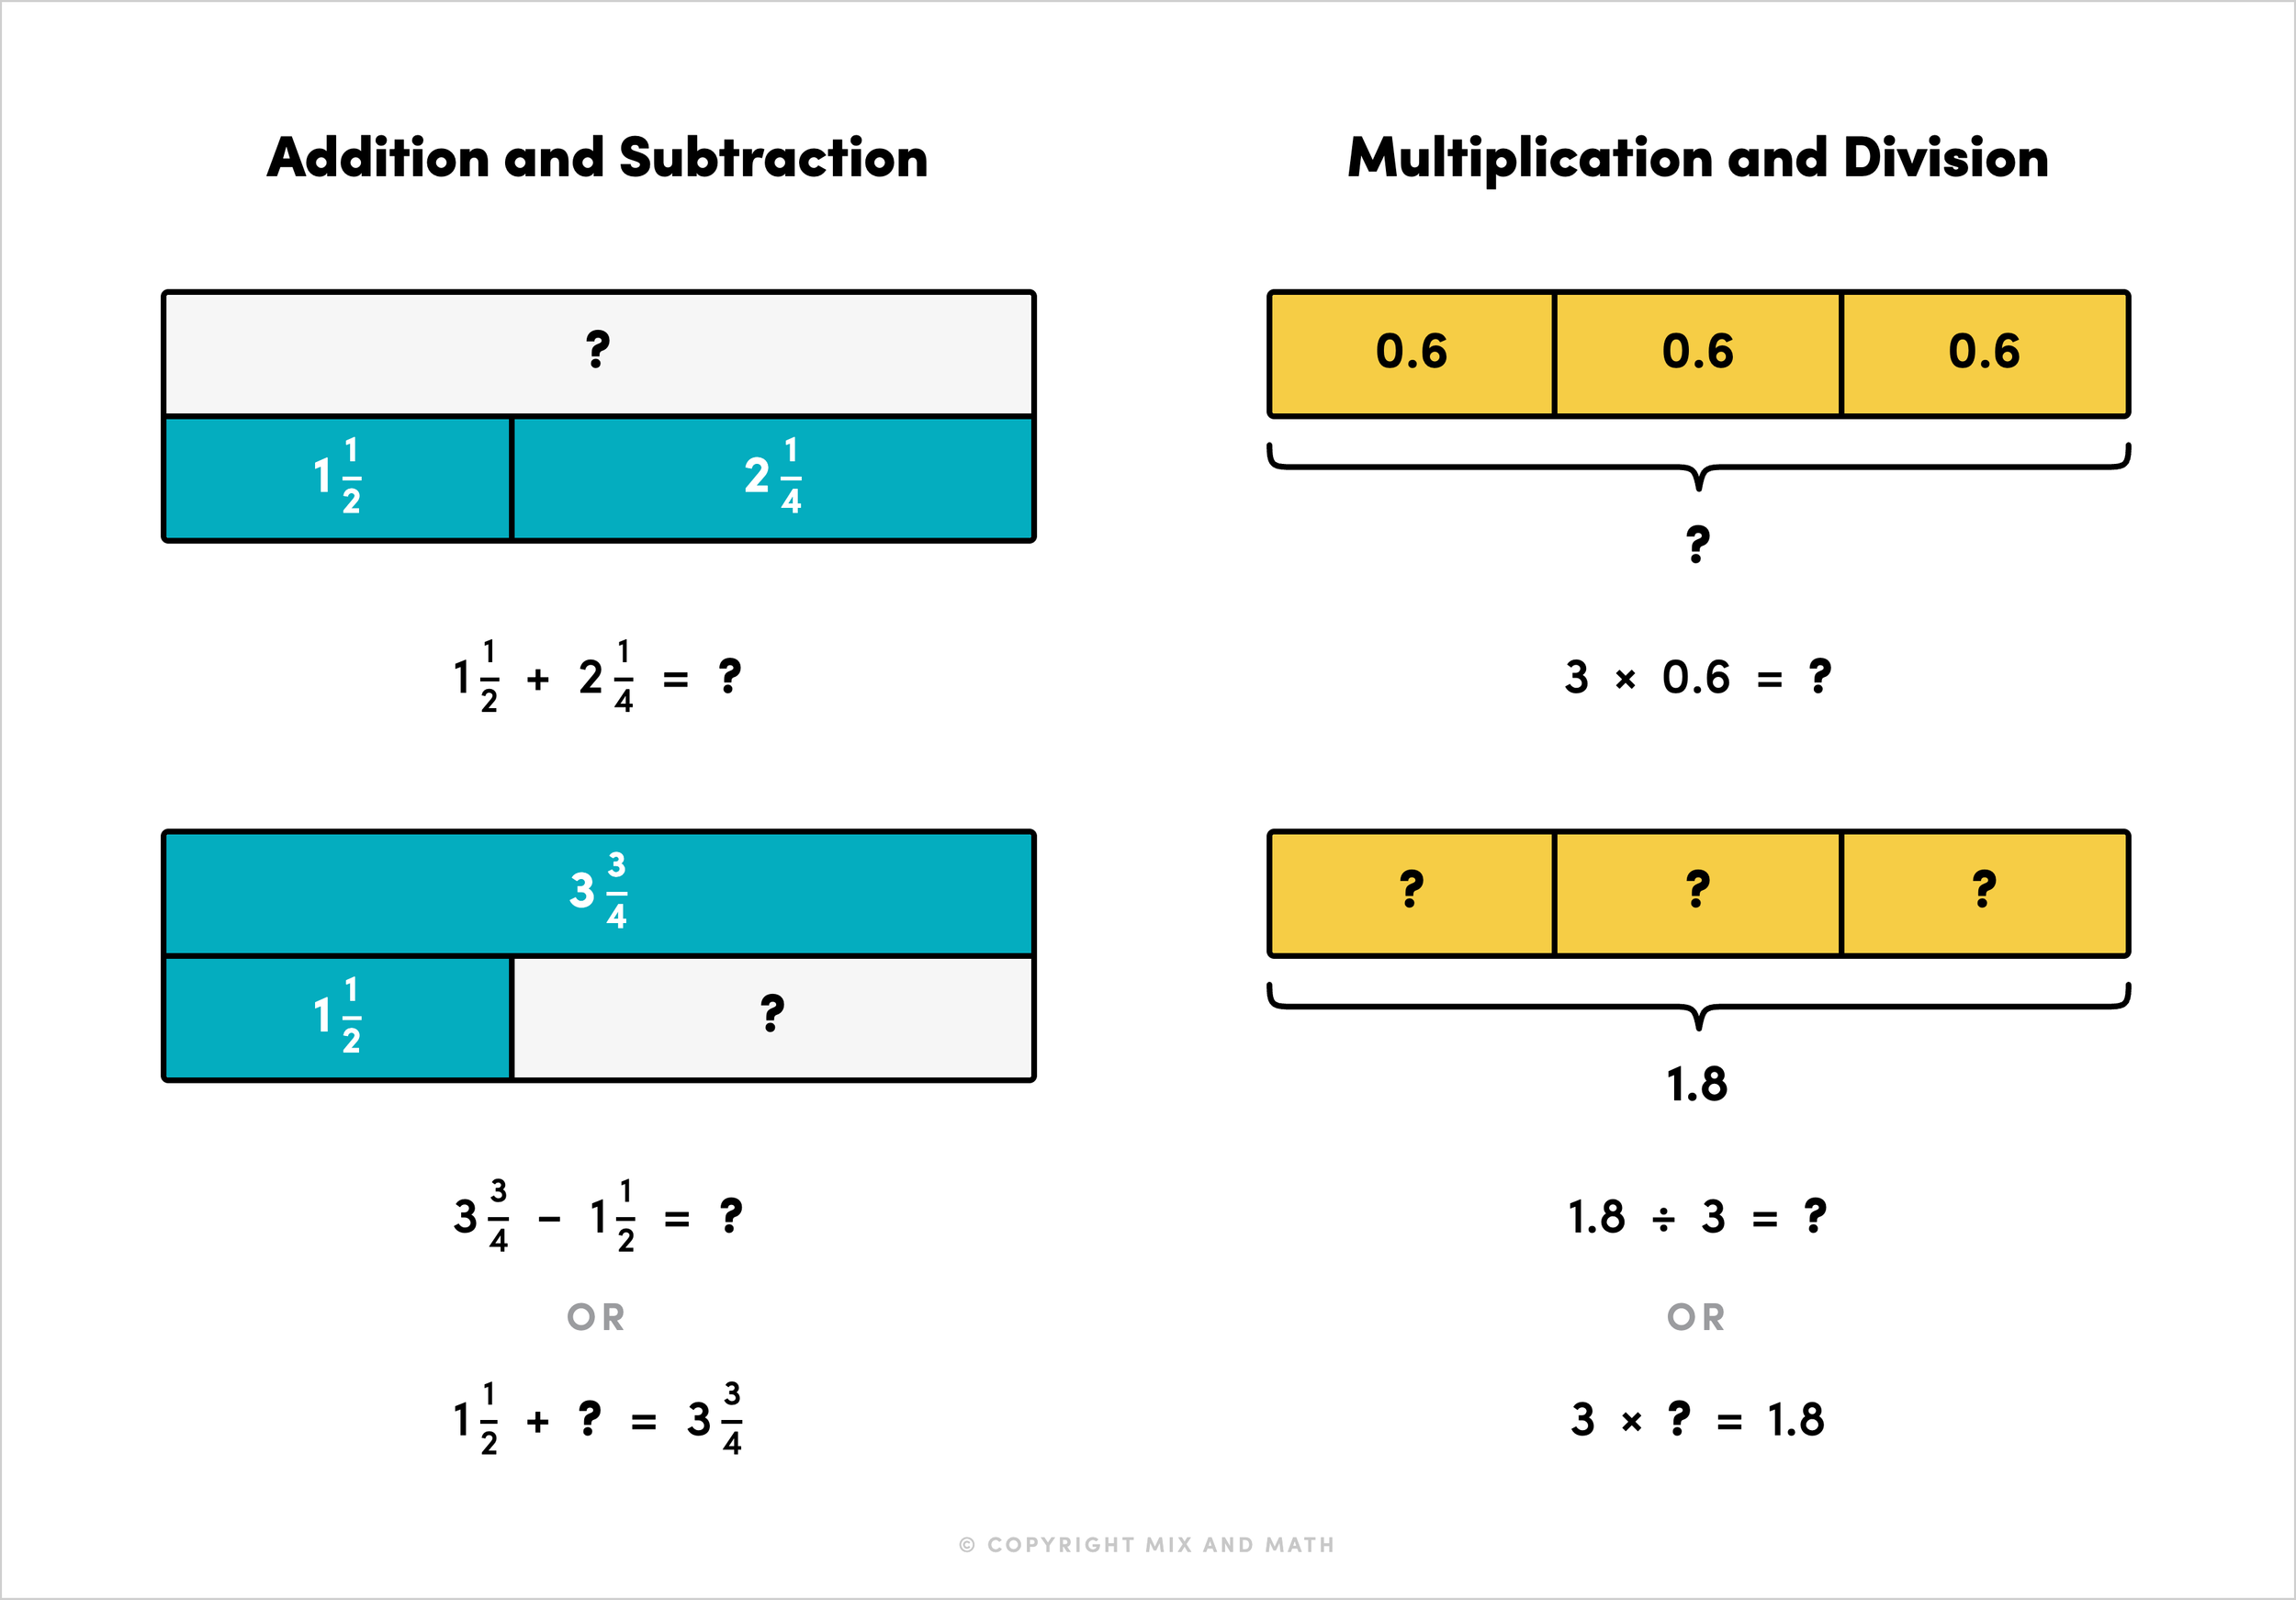
Depending on the operation, tape diagrams can look different, but they all build on the same part-part-whole structure. They represent the whole (or total) with a single rectangle or bracket, and show the parts that make up or relate to that whole.
Using Tape Diagrams to Visualize Word Problems
The structure of a tape diagram helps students organize information in word problems. As students read a problem, we want them to ask themselves what they know and what they need to find out. Instead of simply listing out these ideas, tape diagrams help students figure out how these parts of the situation relate to each other.
Let’s start with this problem:
You biked 2 ¼ miles, then walked for a distance. In total, you went 3 ¾ miles. How far did you walk?
Sometimes students look at problems like this and are intimidated because fractions are involved. Tape diagrams give students an access point to these questions.
Ask students first:
What do you know?
What do you need to find out?
For this problem:
They know they’ve biked 2 ¼ miles.
They know they traveled 3 ¾ miles altogether.
They need to find out how many miles they walked.
Seeing this information in a list is helpful for students when they’re trying to explain their thoughts, but it doesn’t really let them see the relationships between the numbers.
But the tape diagram gives them a chance to organize their ideas into a model.
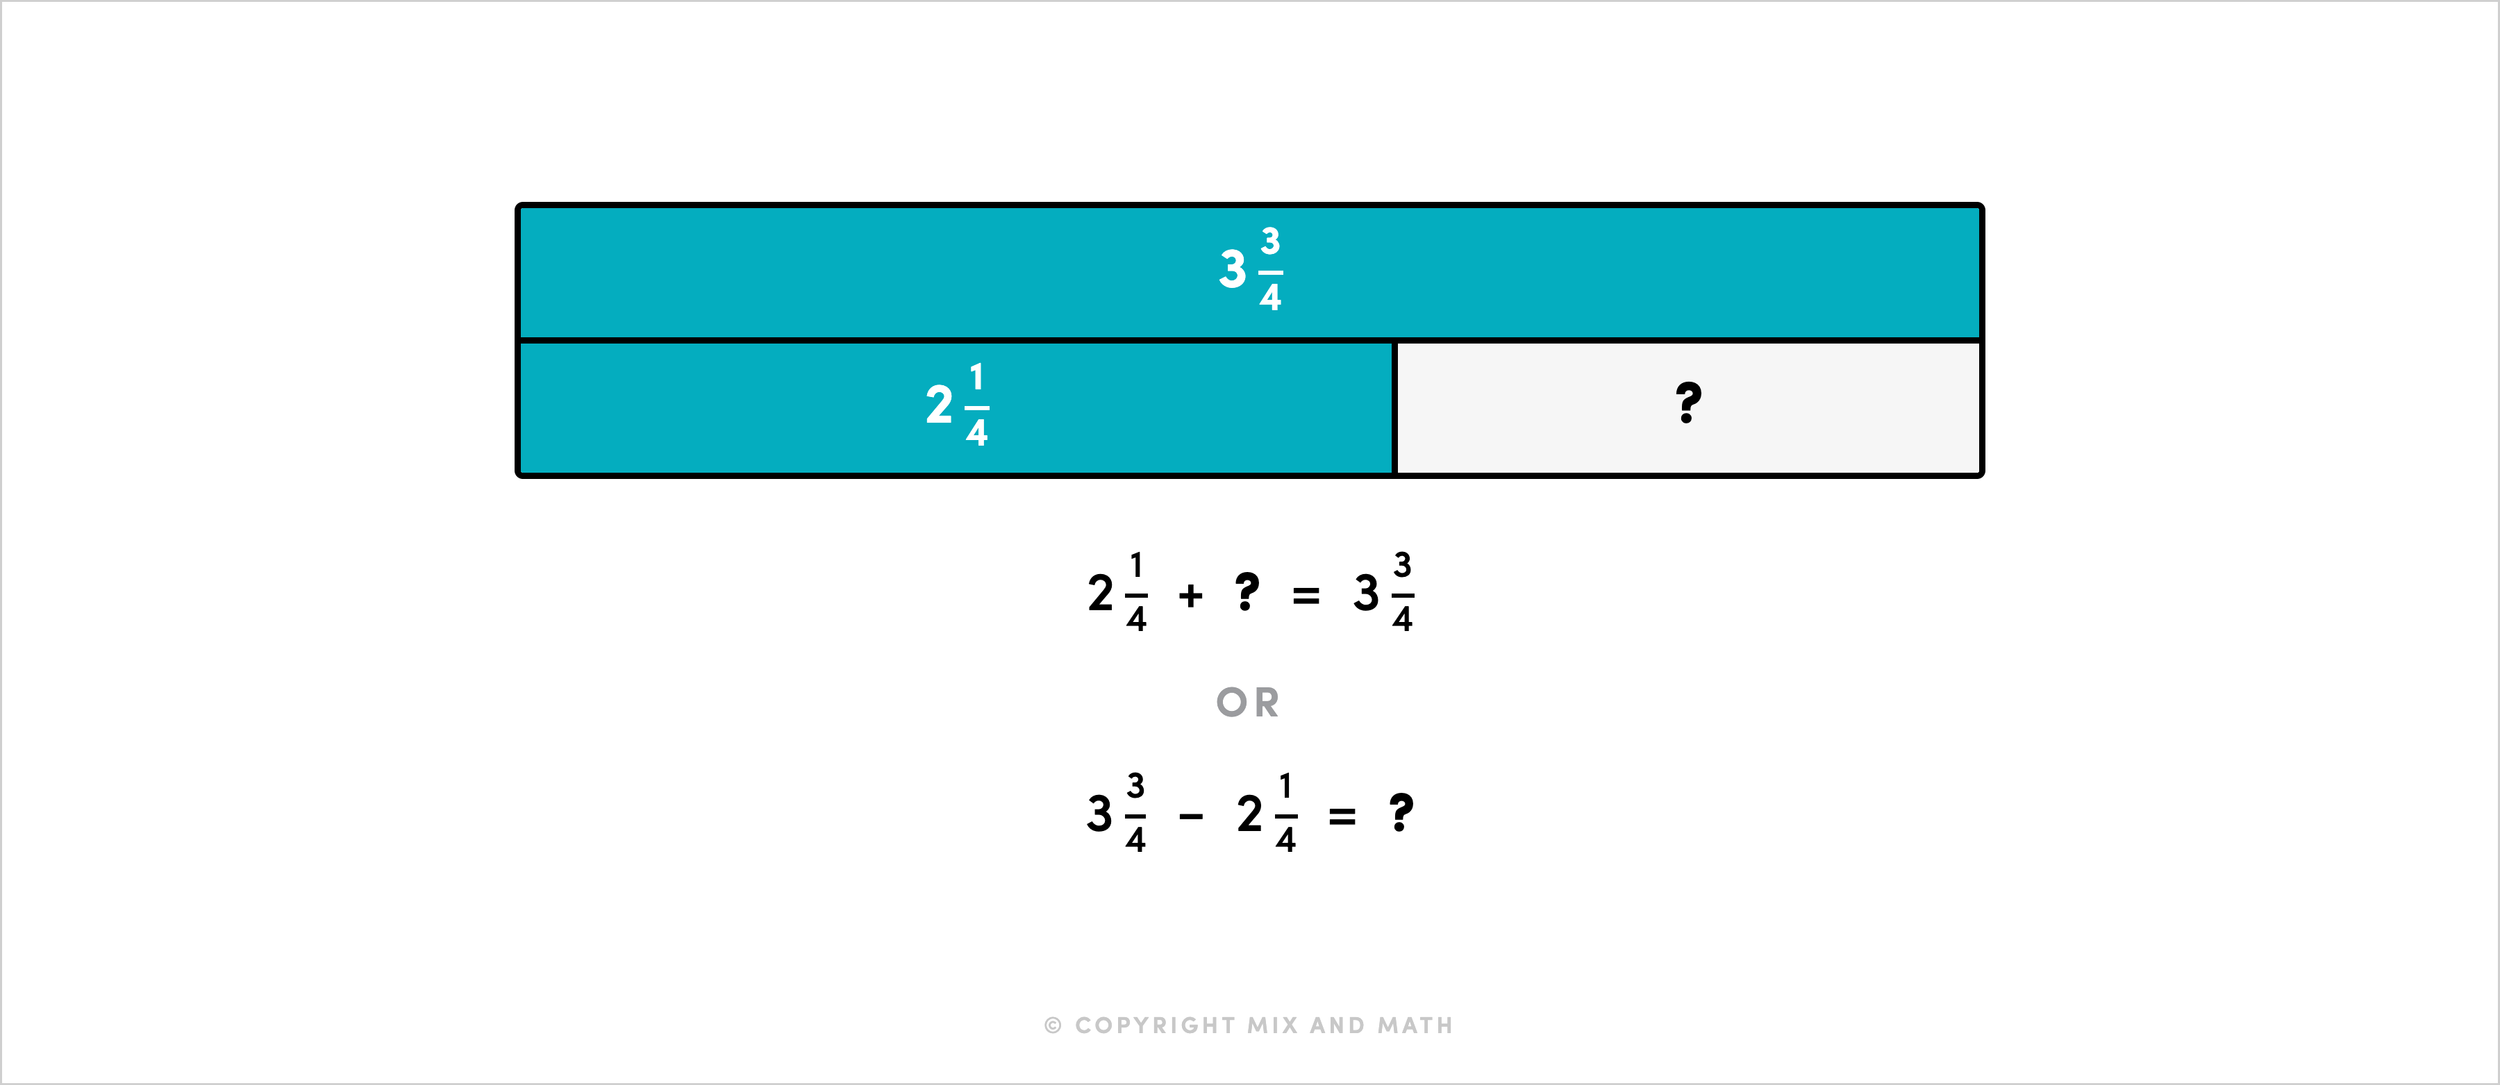
A student could start with something they know. In this case, they know the total distance was 3¾ miles.

Once they have that “whole” (or total distance), they can start to include the parts within that whole. In this question, they know that some of the distance was biked, and the rest was walked, so 3 ¾ would be made up of two parts.
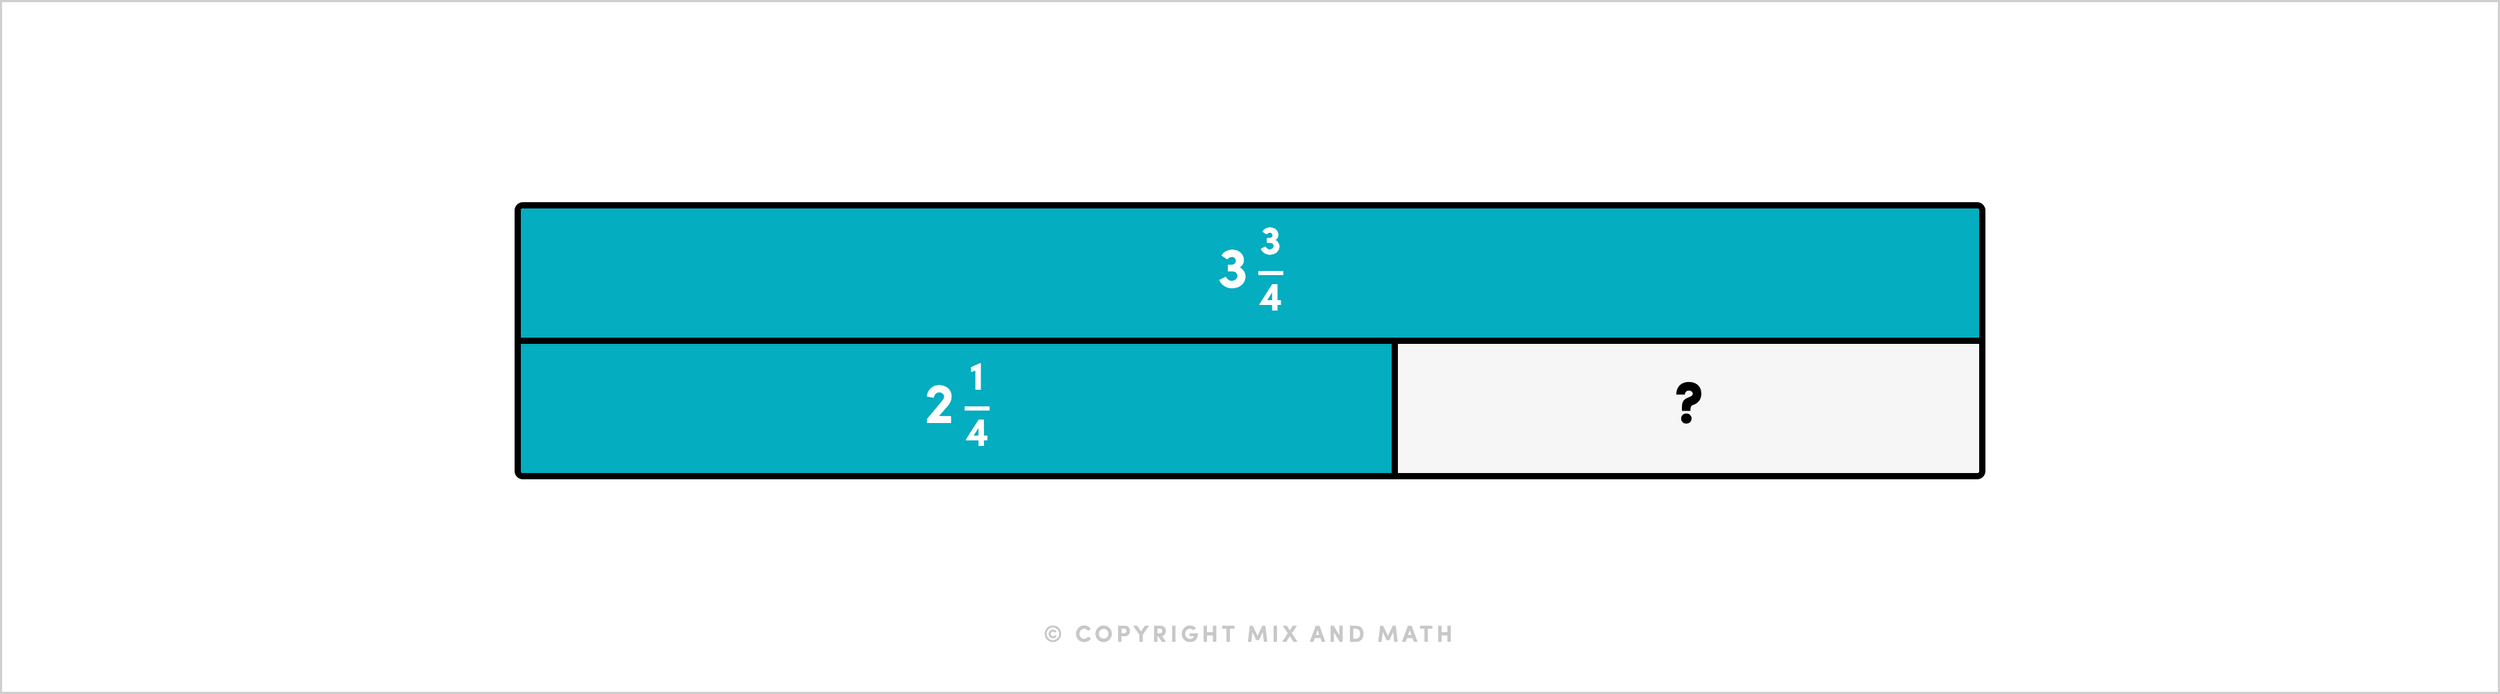
This tape diagram now shows the 2 ¼ miles biked, combined with the unknown number of miles walked.
Now, how do students actually use this model to solve the problem?
Choosing the Right Operation
When students are approached with a real-world problem, it's a common mistake for them to focus on the “keywords” they notice. They might hunt for words or phrases like “altogether,” “total,” or “how many more,” but we know that these don’t always tell the full story of the task or indicate which operation to use.
That’s where tape diagrams can be especially helpful. They encourage students to slow down during the problem-solving process. (Because let’s be honest, most mistakes happen when students rush to solve before they’ve fully understood the problem.)
Let’s look back at the previous problem:
You biked 2 ¼ miles, then walked for a distance. In total, you went 3 ¾ miles. How far did you walk?
Without going through and really thinking about what’s happening in this problem, a student might see numbers 2¼ and 3 ¾ and the word “total.” If they just rely on that keyword, they might choose to add those mixed numbers together.
But if they look back at their tape diagram, they’ll see that adding those two values together wouldn’t actually make sense.
This model shows them that it isn’t 3 ¾ and 2 ¼ being combined, but 2 ¼ and the unknown amount that was walked that is being combined. When they actually see the relationship between the numbers, they can figure out that they have to take 2 ¼ miles away from 3 ¾ miles to solve for the unknown amount. Or, they might count up from 2 ¼ to 3 ¾ to solve! From there, they can make an equation that matches the model.
This idea can be used with all four operations.
Take a look at this problem:
You have 24 chocolate chip cookies and I have 6 chocolate chip cookies. How many times as many cookies do you have as I do?
Right away, you can probably see that keyword “times as many.” If a student is solving quickly, they might think to multiply 24 and 6. But what if they were to visualize the situation instead?
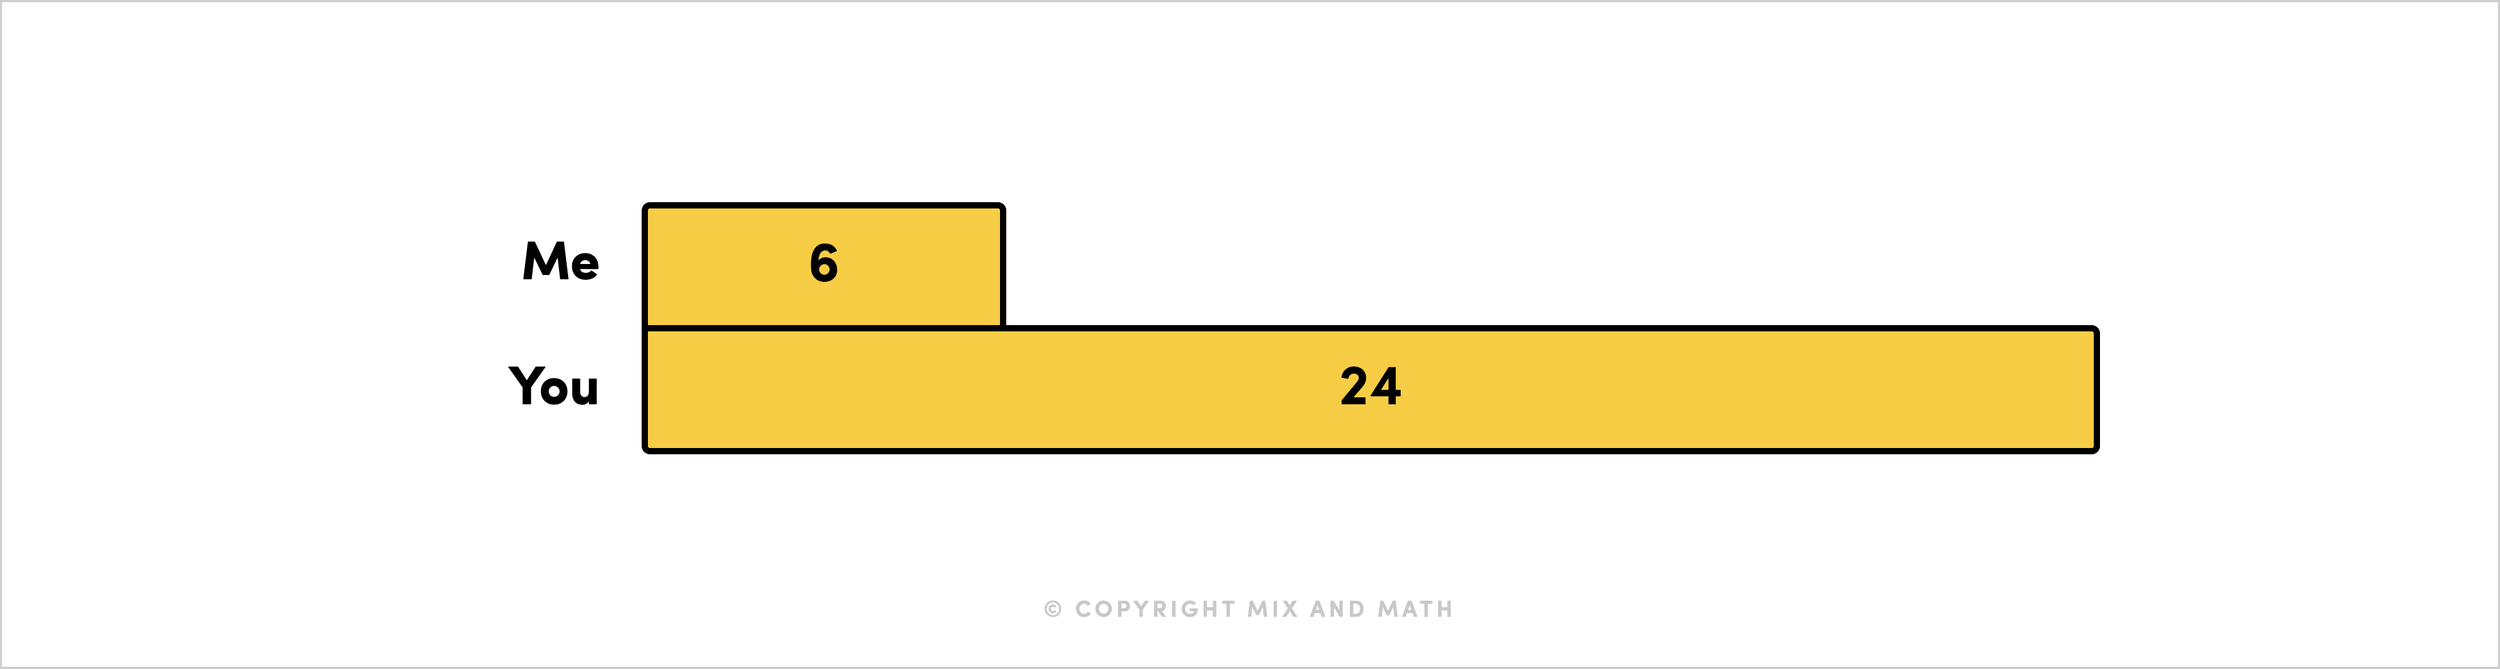
By modeling with a tape diagram, they can see that they’re not finding 6 groups of 24. They’re trying to find out how many groups of 6 can be made from 24.
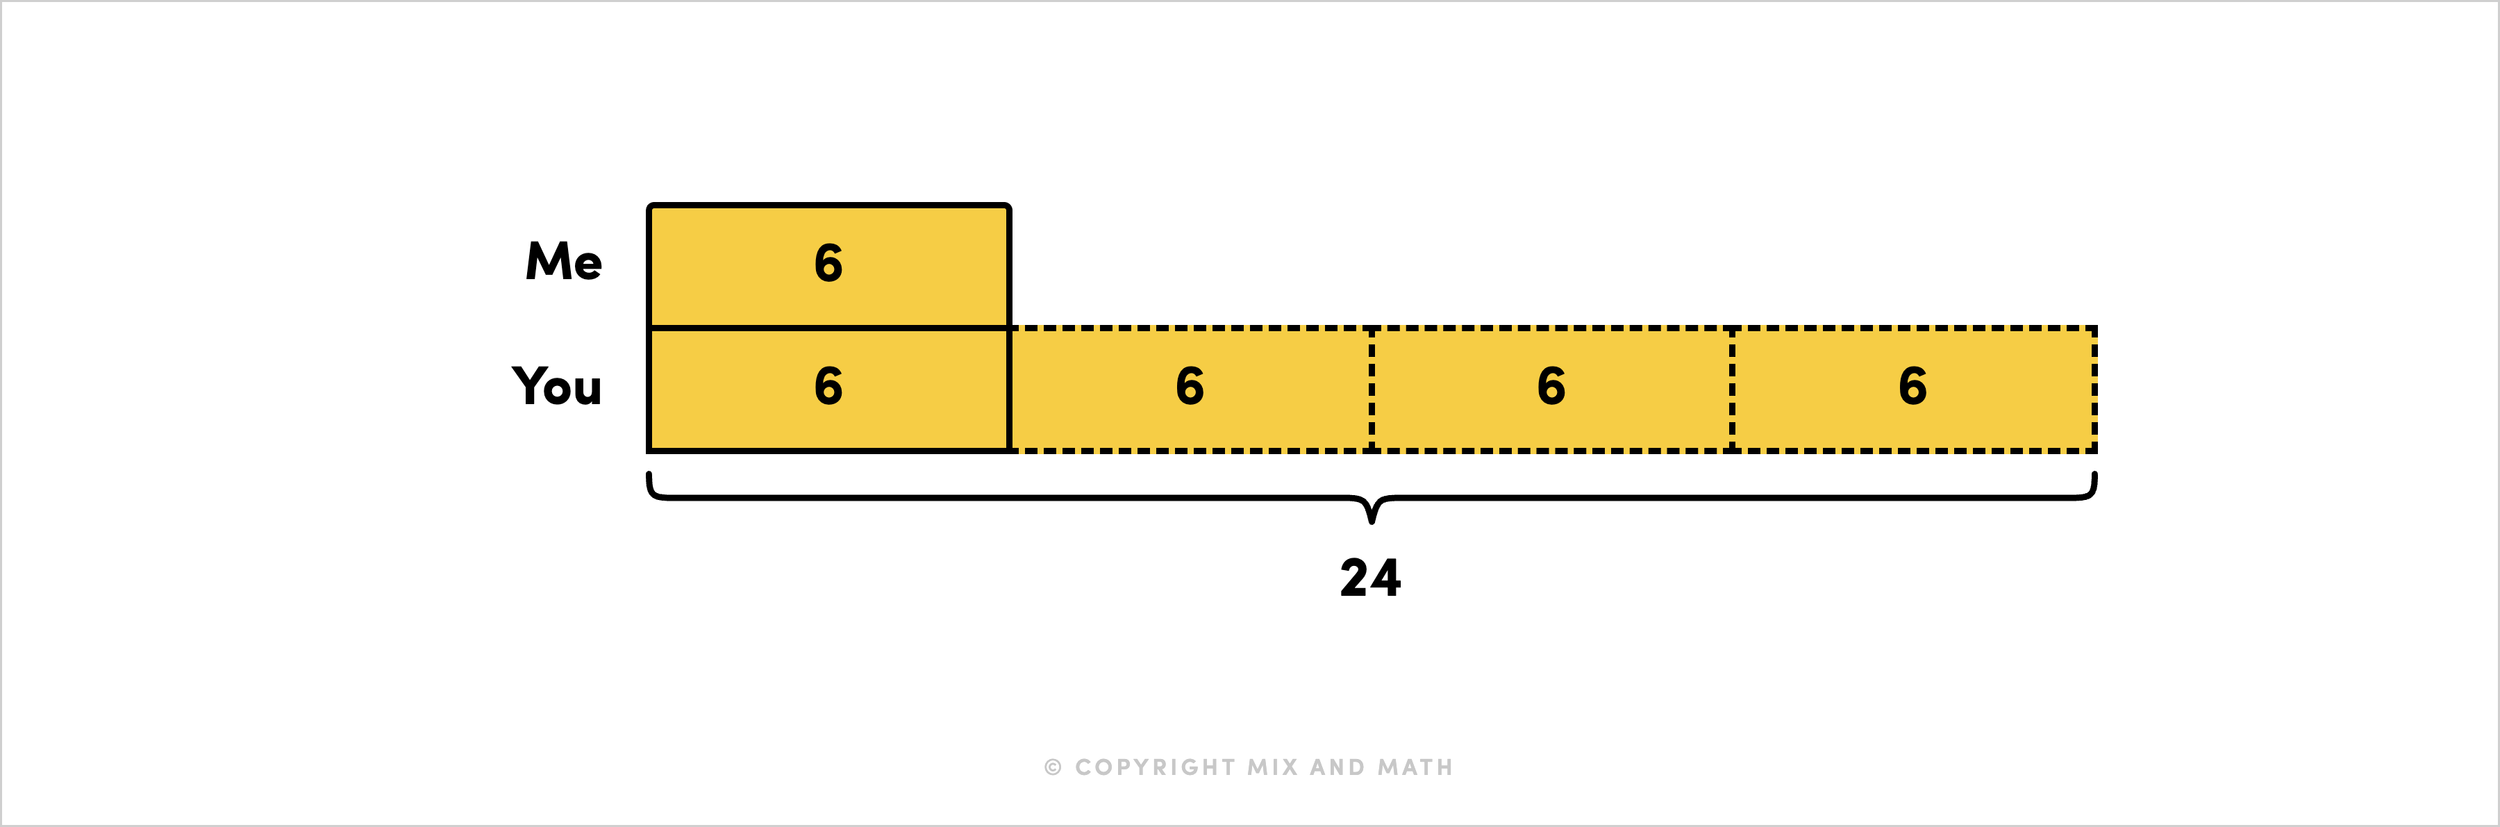
This diagram makes the action of division visible, showing 24 partitioned into equal groups of 6. From this visual, students would then be able to determine that division would help them solve this task.
We’re always looking for ways to stop the use of those dreaded keywords because it isn’t an effective strategy. The key? Students really need to see what’s happening in the problem, and tape diagrams give them that opportunity.
Using Tape Diagrams to Estimate and Reason
It’s important that students make estimations before they solve problems. This helps students check their work and use their number sense to see if an answer is reasonable. We want students to understand how they could use tape diagrams as tools to reason about math.
Think back to the question about walking and biking. In this question, the tape diagram shows them that the unknown amount can’t be greater than 3 ¾ because that’s the total amount. So, if they were to see the word “total” and add the two mixed numbers together, the model would show them that the answer wouldn’t actually make sense.
So, how do we use tape diagrams to estimate?
Students can use the values within the model to determine a reasonable answer. They can see the total amount is 3 ¾, so the unknown amount cannot be more than this value. They could also say that since 2 ¼ is about 2, they can think about the difference between 3 ¾ and 2 and estimate that the solution would be about 1 ¾.
Another teacher move that you can make is to draw the parts of the model to reflect the values in the task. If you look closely at the tape diagram above, you’ll notice that the two parts aren’t actually equal. This isn’t something that we wouldn’t expect our students to do on their own right away, especially since they are still trying to figure out the unknown in this problem. But it is something that we can model to help them develop their number sense.
Students can then use this visual to estimate. Since the unknown part in this model is a bit smaller in size than 2 ¼, they could estimate that the amount walked is less than 2 ¼ miles.
By creating an estimate through the tape diagrams, students are able to assess whether or not their computations are reasonable as they solve.
Using Tape Diagrams Flexibly
Teaching constantly feels like we’re creating something new or looking for a “better” tool for our students to use. That’s honestly the biggest superpower of the tape diagram: they can be used across multiple grade levels and all four operations.
Students can begin by using tape diagrams for whole numbers, progress to fractions and decimals, and even use the models for algebraic equations. That means that you don’t have to teach a new model for problem-solving year after year.
They can even be used to support concepts like measurement conversion.
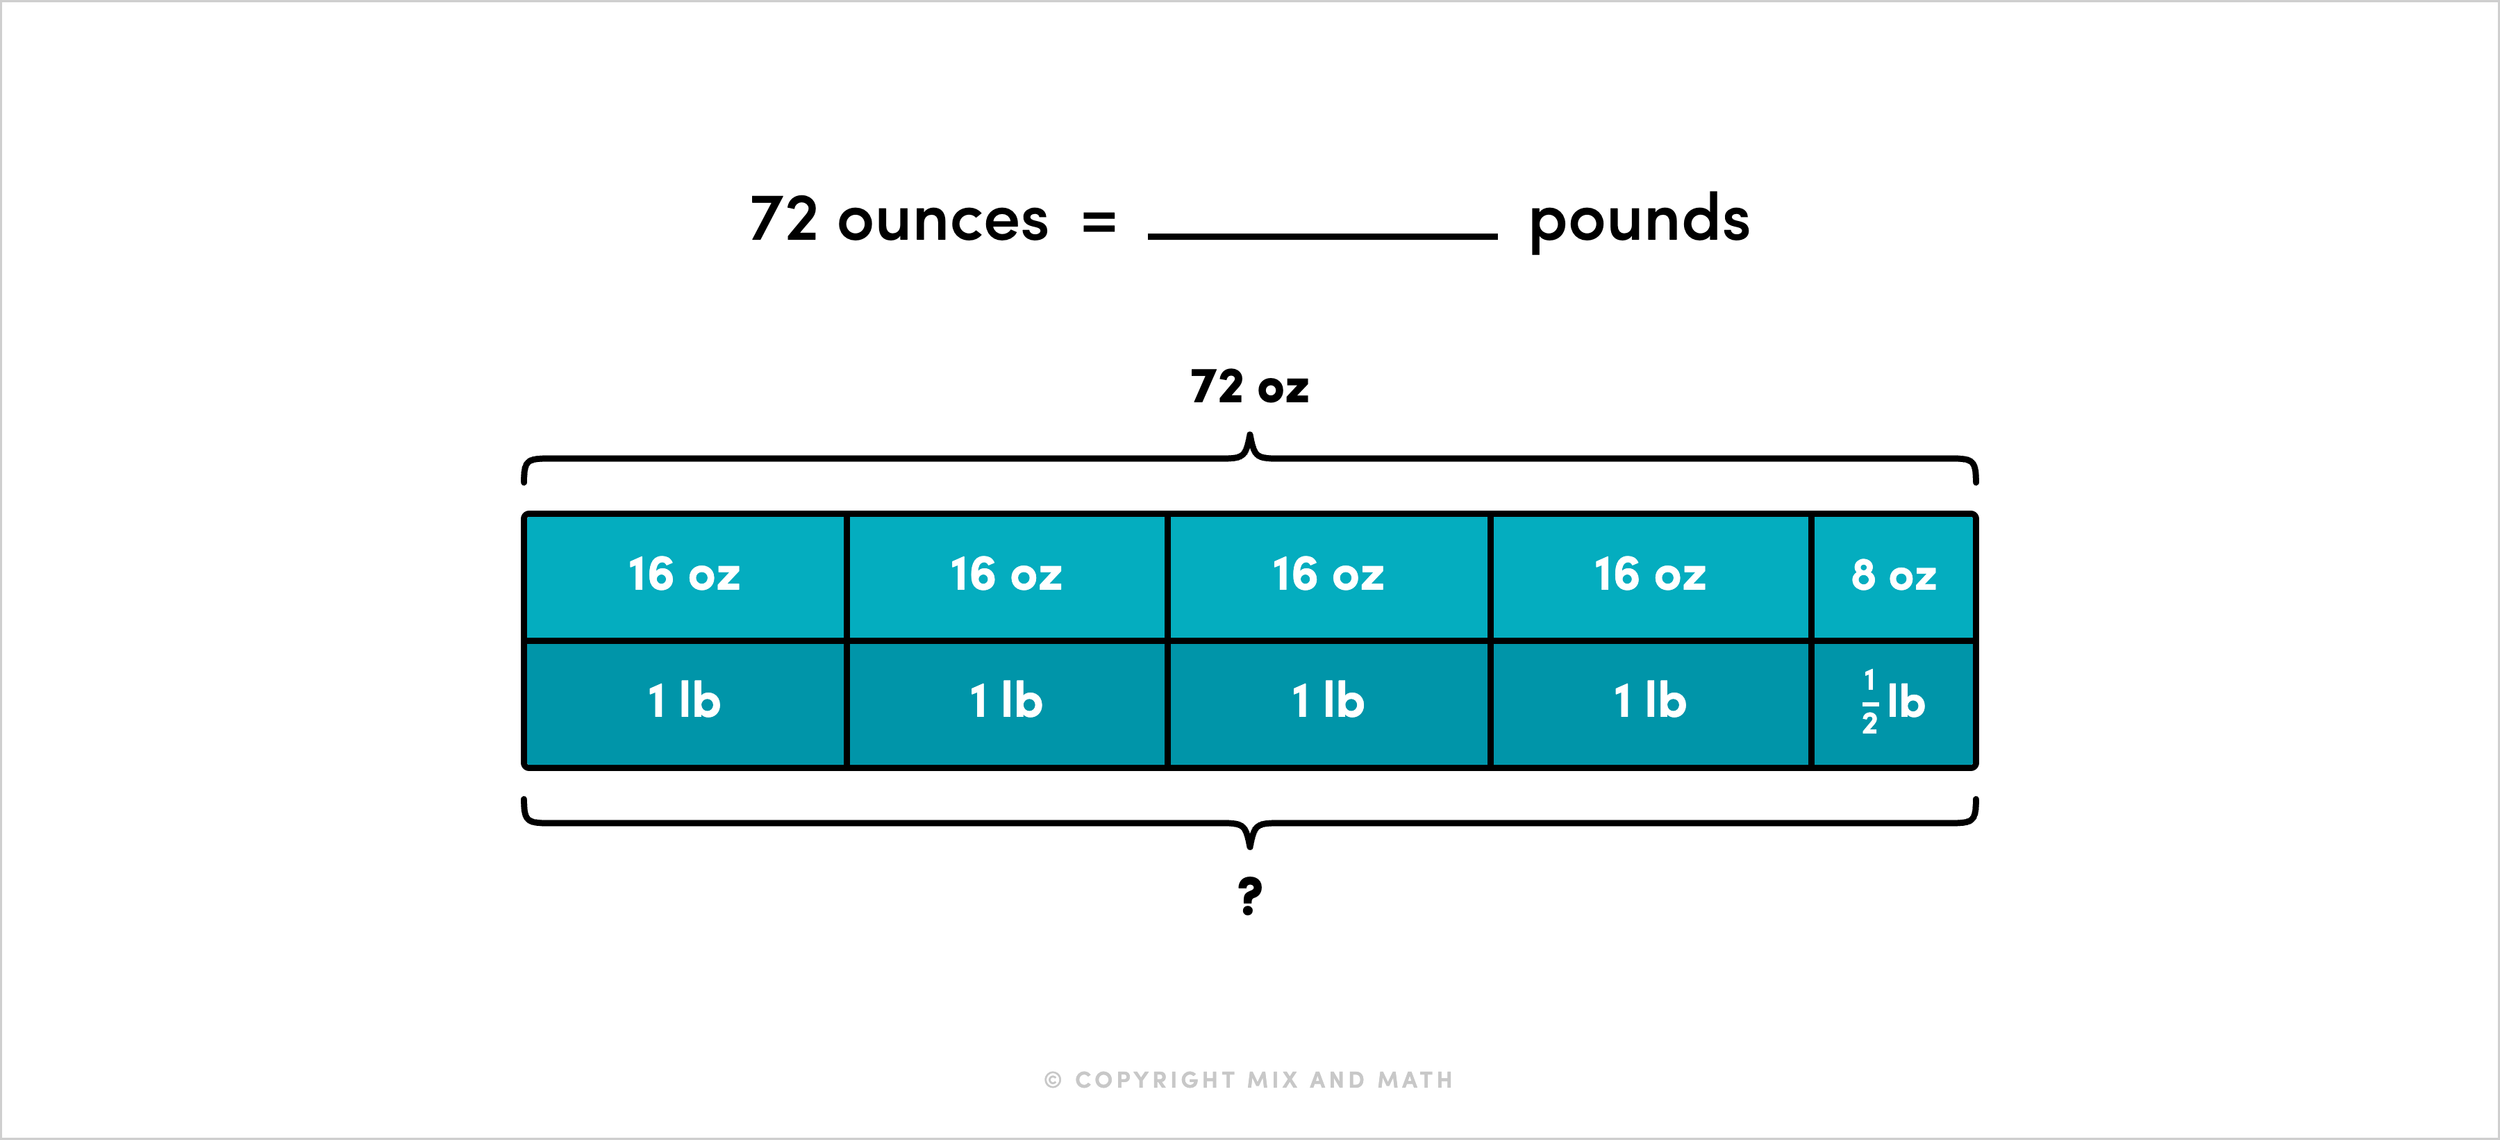
The versatility of tape diagrams gives students a familiar model that they can rely on as numbers and concepts become more complex. Instead of spending time learning a new representation for every concept, students can focus more on developing their understanding of new math concepts.
Ultimately, the goal isn’t for students to draw a tape diagram for every single problem they encounter, but to use the model as a way to see how mathematical relationships and operations can be represented to solve real-world problems. We want students to reason, estimate, and thoughtfully grapple with the tasks, not just rush to a solution. Tape diagrams support students in developing this skill so that they can learn to solve problems independently.
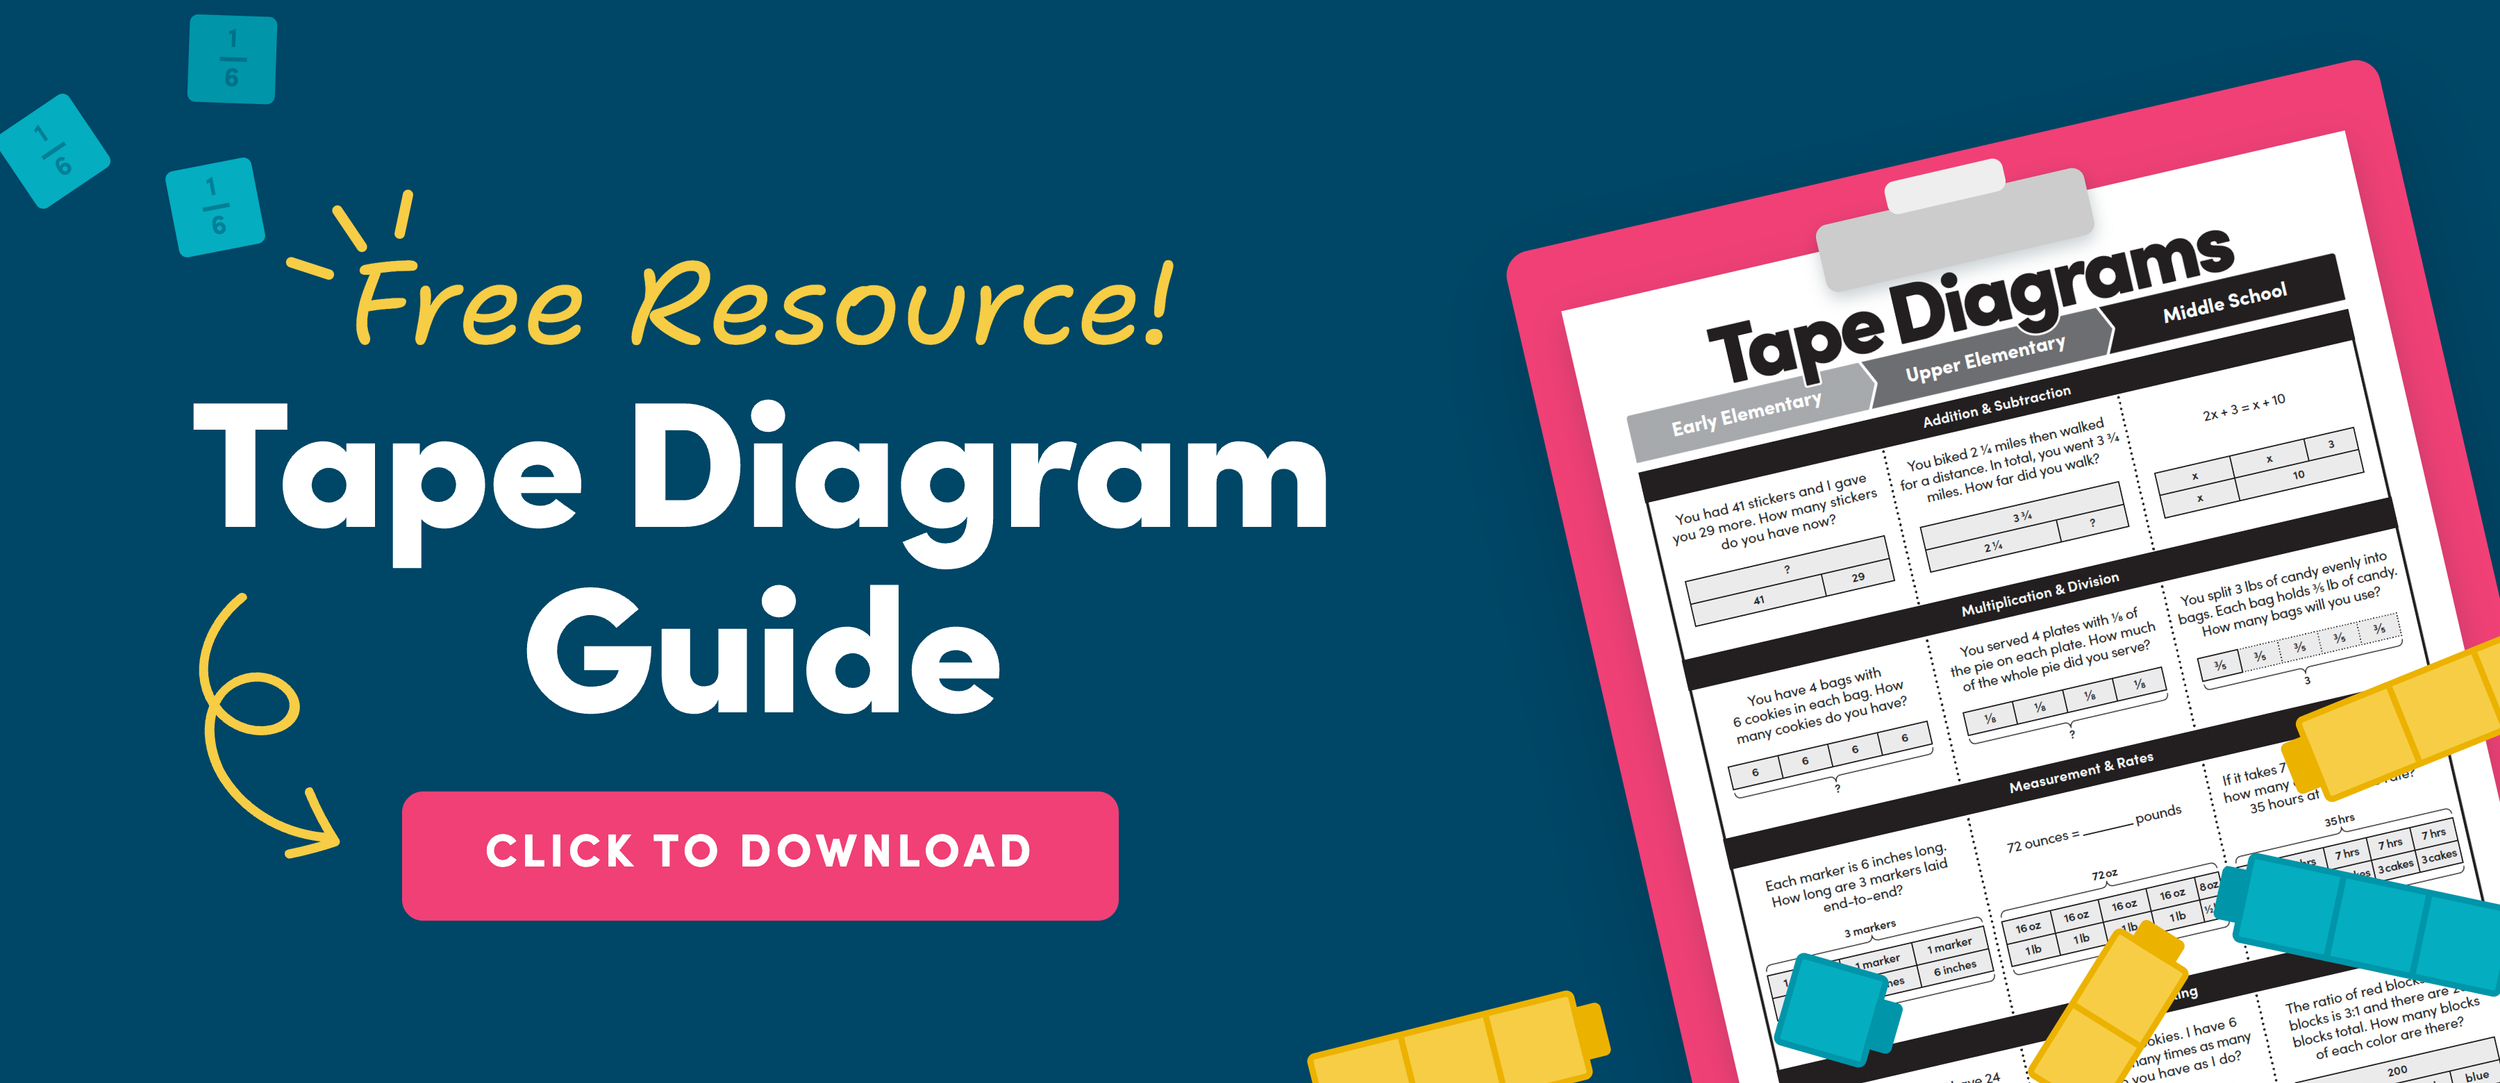
Want to see how tape diagrams can be used across different math concepts and grade levels? Download our FREE Tape Diagram Guide!